
Idealized theory - a brief summary
[<- Previous]
[Contents of this lecture]
[Next ->]
Let me describe what we find if we try to calculate what happens with the simplest possible model of the hammer-string interaction. (Details may be found, along with a survey of the history of this problem, in Hall (1986, 1987a, 1987b).) There is a fairly simple differential equation that describes what must happen if the hammer is pictured as only an extra mass temporarily attached to the string (Fig. 7). We can write solutions to this equation that represent first a simple wave travelling away from the hammer in both directions (the curve labelled 0), and then the reflection of this wave from the ends of the string. When a reflected wave tries to pass the hammer, it pushes downward on it, and this interaction generates a new outgoing wave (labelled 1). This wave in turn, after reflection from the ends, gives rise to grandchildren (labelled 2), and so on. Thus, if the hammer remains in contact long enough, the total disturbance will include a large number of waves travelling in both directions. Such a theory, with perfectly hard hammers, will surely not predict what happens in a normal piano. But it could be applied to the case where a very "tinny" sound is achieved by putting thumbtacks (an American term; you may know them as "drawing pins") in the hammers.
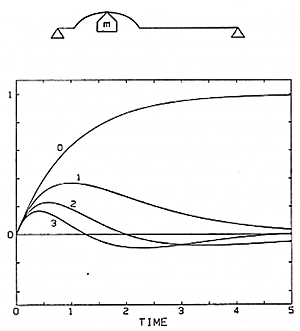 Fig. 7. Shapes of the successive generations of waves created on a flexible string by the impact of a point-mass hammer; (0) initial wave, (1) daughter wave, (2) granddaughter wave, etc. The curves are normalized so that they may represent any key. Time is given in multiples ("units") of the typical hammer deceleration time (mc/2T) and the displacement in multiples of (mcV/2T), where m is the hammer mass, c is the propagation velocity on the string, T is the string tension, and V is the initial hammer velocity. For a blow in the middle register at mf the "units" would typically correspond to 1 ms and 1 mm, respectively.
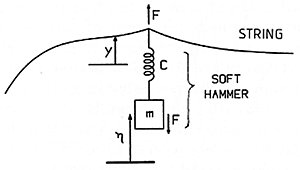 Fig. 8. Representation of a soft hammer as a mass with a spring between it and the string. The compression of the hammer is equal to the difference between the displacement of the hammer after string contact (n), and the displacement of the string (y).
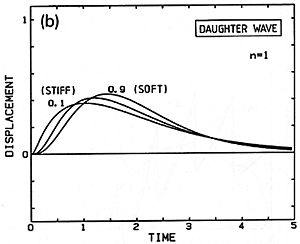
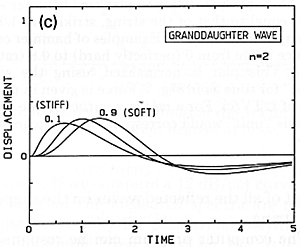
If we admit that the normal felt hammers are soft, we must go on to do our calculations based on a picture where a spring cushions the contact of the hammer mass with the string (Fig. 8). Now the exact shape of the wave travelling along the string depends on the strength of the spring (Fig. 9a). Here 0.1 denotes small compliance, meaning a strong spring and a stiff hammer; 1.5 means large compliance, a weak spring and a soft hammer. Figs. 9(b) and (c) show the effect of the compliance on the daughter and granddaughter waves. It is not surprising that greater compliance makes a smoother, more gentle wave.
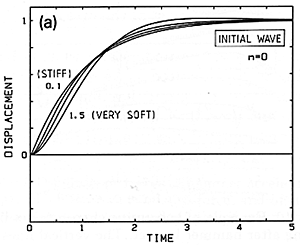 Fig 9. Initial wave (a) and its descendants (b) and (c) created by impact of an idealized soft hammer on a string. The same "units" as in Fig. 7.
Now doing a complete calculation of the string motion, including all these waves, would be very impractical by hand. But it is an ideal problem for a small computer, which can produce pictures like Fig. 10 showing the total effect of all the reflected waves on the shape of the string.
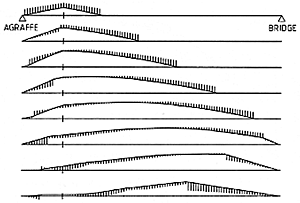 Fig. 10. Example of successive shapes taken by a string after hammer impact. The vertical lines represent how fast each part of the string is moving.
The computer program can be responsible not only for the arithmetic, but also for deciding at each moment how many waves are present, and for determining when the hammer finally loses contact with the string. A typical result is shown in Fig. 11, expressed in terms of the history of the force applied to the string. See how a soft hammer pushes rather steadily on the string, but a very hard hammer gives a series of sharp pulses of force. Once this information is known, it can be used to calculate how much energy has been delivered to the string, and how that energy is divided among the different harmonic modes.
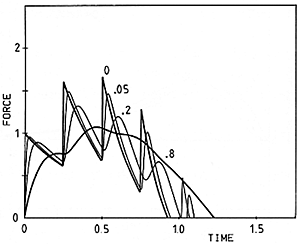 Fig. 11. Force history for an idealized hammer with mass equal to that of the string, striking at 1/8 its length from one end. Examples of hammer compliance range from 0 (perfectly hard) to 0.8 (rather soft). This plot is normalized, using the same "unit" for time as in Fig. 7. Force is given in multiples of (2TV/c). For a mf blow in the middle register this "unit" would correspond to approximately 10 N.
What is most interesting is to ask the computer to do many of these calculations, in order to see how the results depend on the properties of the hammer. Fig. 12 shows some sample predicted spectra, with very hard hammers at the back and softer ones toward the front; as we would expect, this says that the softer hammers would not have as much of the higher harmonics in their sound.
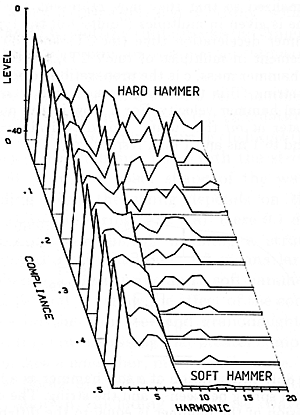 Fig. 12. Sample predicted spectra for a simplified (linear) hammer as a function of its compliance (softness).
[<- Previous]
[Top]
[Contents of this lecture]
[Next ->]
This lecture is one of Five lectures on the
Acoustics of the piano
© 1990 Royal Swedish Academy of Music
 Fig. 7. Shapes of the successive generations of waves created on a flexible string by the impact of a point-mass hammer; (0) initial wave, (1) daughter wave, (2) granddaughter wave, etc. The curves are normalized so that they may represent any key. Time is given in multiples ("units") of the typical hammer deceleration time (mc/2T) and the displacement in multiples of (mcV/2T), where m is the hammer mass, c is the propagation velocity on the string, T is the string tension, and V is the initial hammer velocity. For a blow in the middle register at mf the "units" would typically correspond to 1 ms and 1 mm, respectively.

 Fig. 8. Representation of a soft hammer as a mass with a spring between it and the string. The compression of the hammer is equal to the difference between the displacement of the hammer after string contact (n), and the displacement of the string (y).
 Fig 9. Initial wave (a) and its descendants (b) and (c) created by impact of an idealized soft hammer on a string. The same "units" as in Fig. 7.


 Fig. 10. Example of successive shapes taken by a string after hammer impact. The vertical lines represent how fast each part of the string is moving.
 Fig. 11. Force history for an idealized hammer with mass equal to that of the string, striking at 1/8 its length from one end. Examples of hammer compliance range from 0 (perfectly hard) to 0.8 (rather soft). This plot is normalized, using the same "unit" for time as in Fig. 7. Force is given in multiples of (2TV/c). For a mf blow in the middle register this "unit" would correspond to approximately 10 N.
 Fig. 12. Sample predicted spectra for a simplified (linear) hammer as a function of its compliance (softness).