[<- Previous] [Contents of this lecture] [Next ->]
Soundboards vibrate more readily at their modal or resonance frequencies than at other frequencies. The photos in Figs. 17 - 20 show how a piano soundboard vibrates at some of its modes (resonances).
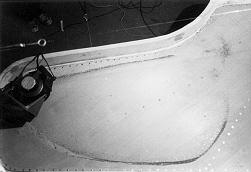
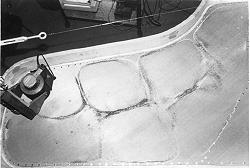
The lowest frequency at which a soundboard can vibrate strongly is called the first mode. In Fig. 17 we see an experiment in which a concert grand piano soundboard has been vibrated at its first mode. The vibration generator, the circular object that can be seen to the left in the photos, has been connected mechanically to the soundboard at a point near its edge. For such a test the procedure is the following: Before being vibrated the soundboard is covered uniformly all over its surface with a mixture of fine particles (in this case sand and "glitter"). Then the vibration generator is turned on and tuned slowly until its frequency coincides approximately with that of a soundboard mode, as will be indicated by a noticeable increase in sound level from the soundboard. Then the generator level is increased until the acceleration of the particles exceeds "1 g" (the acceleration of gravity, 9.8 m/s2) and the particles begin to dance on the soundboard. As they dance, the particles gradually collect in those areas that are not moving at all or are moving with minimum velocity. This produces a pattern called a Chladni figure, so named after the famous German physicist.
The first mode of this soundboard occurred at 49 Hz. In this mode, it is the center of the soundboard that moves most violently; the edges, where you see most of the particles, nearly stand still. A piano soundboard rapidly loses its effectiveness as a sound radiator at frequencies below that of the first mode, so notes below the first modal frequency usually do not have very much energy in the first partial.
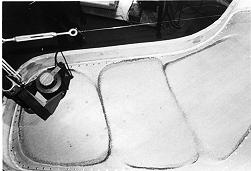
In Figs. 18, 19, and 20, you can see how the soundboard moves at some of its other modes. Remember that the particles collect where the soundboard is moving least.
 |
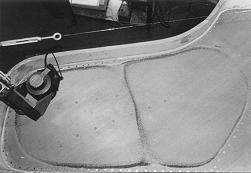 |
| Fig. 17. First (lowest) soundboard mode at 49 Hz. | Fig. 18. Second mode at 67 Hz. |
 |
 |
| Fig. 19. Third mode at 89 Hz. | Fig. 20. Eighth mode at 184 Hz. |
The modal frequencies are determined by many factors, the primary ones being the material, size and shape of the soundboard, its thickness and grain direction, and also the material, dimensions, and placement of its ribs. Secondary factors include the characteristics of the rim or case to which the soundboard is attached. In general, the thicker the soundboard, the louder the piano but the less the duration of its tone. Soundboard design is often a compromise.
Today there is a better way, called modal analysis, to study the vibration of piano soundboards. Using this method, the soundboard is tapped with a special hammer that is fitted with a force transducer. An accelerometer attached to the soundboard responds to vibrations caused by the hammer and the force and acceleration signals are stored digitally. The tapping is repeated at a number of different preselected points on the soundboard, and after all the data has been taken, a computer analyzes it and identifies the modes (Suzuki 1986). With modern equipment it is possible to see an animated display of the modal motion of the soundboard on a TV-screen, a technique which will be described in more detail in the lecture by Klaus Wogram.
Fig. 21 presents modal information in another way: it is a graph giving the velocity of motion of the soundboard at one particular point (for a constant driving force), as a function of frequency. This plotted quantity is called mobility, and is the reciprocal of mechanical impedance. Each of the large peaks you see in Fig. 21 corresponds to a particular soundboard mode like those earlier shown in the Chladni patterns.
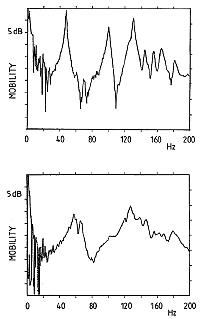 Fig. 21. Driving point velocity vs. frequency for concert grand soundboard with no strings or plate (top), and with the piano fully assembled and tuned (bottom).
The frequency and shape of soundboard modes are affected by the strings and the cast-iron plate. For the graph at the top in Fig. 21, the plate and strings were removed from the piano. The lower graph in the same Fig. shows the mobility at the same point on the same soundboard with the strings and plate in place and the piano fully tuned. Notice how much the picture has changed: the first mode has shifted upward in frequency from 48 Hz to around 60 Hz, and the modal peaks are broader than before and not so high. In pianos of this size (concert grand) you can often identify the first mode by playing single notes up and down the scale. You may feel a slight increase in the vibration level of the case, usually around C2 - D2 (keys 16 - 18), and you may hear an increase in the sound level of the first partial.
In order to do the analyses just mentioned we have to test an actual soundboard. So we need first to build a piano before we can measure it. But now, by still another new technique called finite element analysis (FEA), we can construct a model of the proposed soundboard with computer software. Then, using a computer, we can find out how the soundboard will move before we build the piano!
[<- Previous] [Top] [Contents of this lecture] [Next ->]
This lecture is one of Five lectures on the Acoustics of the piano
© 1990 Royal Swedish Academy of Music