[<- Previous] [Contents of this lecture] [Next ->]
The vibration energy of the string is transferred to the soundboard, transformed from mechanical to acoustic energy, and radiated as airborne sound. The rate at which this energy flow takes place is determined by the properties of the soundboard (the "consumer") in relation to the properties of the string (the source). In engineering terms this relation is referred to as "impedance matching." The loading exerted by the soundboard on the string can be expressed by means of its input impedance (Z), which is defined as the excitation force (F) divided by the resulting velocity (v) at the point of excitation.
Z = F/v
A high value of the input impedance means that a large force must be expended in order to achieve a certain vibration velocity, whereas a low impedance means that a smaller force is sufficient to achieve the same velocity. Actually the impedance also includes a phase angle (φ), which tells us about the character of the impedance (massy or springy).
A measuring setup for input impedance of piano soundboards is shown in Fig. 2 (Wogram 1984). An electrodynamic shaker is mounted on a carriage, which is moveable to any position of the soundboard. On the shaker an impedance head is mounted, which consists of two vibration pickups. The impedance head makes it possible to measure the excitation force and vibration velocity simultaneously, in other words, the two quantities needed to obtain the input impedance. A block diagram of the measuring setup and a description of the measurement procedure are given in the box below.
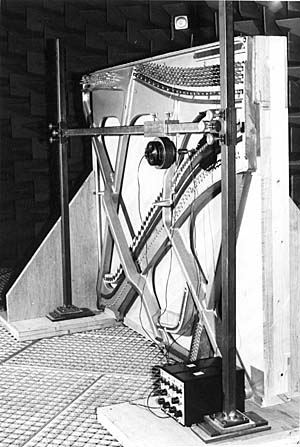 Fig. 2a. Measuring setup for impedance measurements. Stand (vertical beams) and crossbeam with movable carriage.
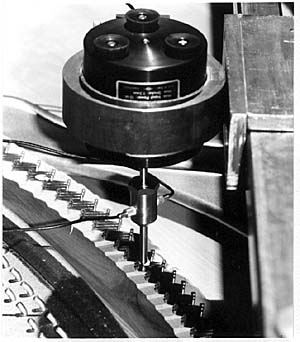 Fig 2b. Detailed view of bridge with shaker, impedance head and metal pin connecting to the bridge.
In order to obtain a representative set of measurements, no less than fourteen measuring points were analyzed for each instrument, spaced about 12 cm apart along the bridges (see Fig. 3). The strings were muted with strips of felt in order to prevent sympathetic vibrations of the strings from influencing the measurements.
 Fig. 3. Soundboard of an upright piano with the positions of the measuring points (MP1 - MP14) marked on the bridges.
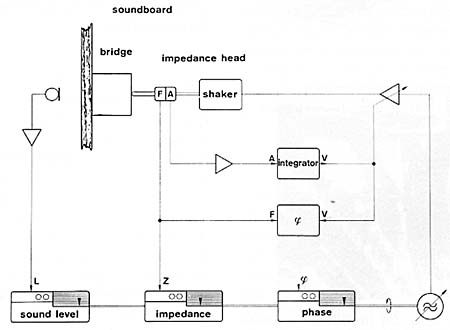
The technique used for an impedance measurement is briefly the following. The soundboard is driven by a shaker at a selected point on the bridge, the force being transmitted via the impedance head. The shaker is fed by a swept sine wave in the frequency range from 20 Hz to 10 kHz, supplied by a tuneable oscillator and an amplitude controlled amplifier (AVC). The output signal of the acceleration pickup (A) in the impedance head is integrated and fed to the AVC-amplifier as a velocity signal (v). This amplifier regulates the input signal to the shaker so that the velocity at the bridge remains constant over the entire frequency range. Since the velocity remains constant, the force (F) is proportional to the input impedance (Z), which means that with proper calibration, the obtained force curve can be interpreted as an impedance curve.
The magnitude of the impedance thus determined is registered by a level recorder, and the phase angle by a second similar instrument. Another level recorder connected to other measuring instruments simultaneously registers the sound level at a distance of 2 m from the soundboard. In this manner, we obtain three curves for each measuring point representing the magnitude of the impedance (Z), and its phase angle (φ), and the sound level (L). These three curves summarise the acoustic properties of the soundboard.
Fig. 4. Block diagram of input impedance and sound level measurements.
[<- Previous] [Top] [Contents of this lecture] [Next ->]
This lecture is one of Five lectures on the Acoustics of the piano
© 1990 Royal Swedish Academy of Music