[<- Previous] [Contents of this lecture] [Next ->]
The results presented so far have illustrated that the measurements of input impedance and sound radiation are influenced by the position of the point of excitation. In order to understand this influence we need to know how the soundboard vibrates. Modal analysis is a convenient method for this purpose. With this method, it is possible to map the vibration modes (resonances), and to measure their frequencies and damping. The motion of the soundboard when vibrating at the individual modes can also be observed in slow motion on a computer display, which gives a good understanding of how the soundboard vibrates.
 Fig. 12. Modal analysis, sketch of measurement method.
The preliminary measurement data from the analyzer (the complex transfer functions) are later transmitted to a small computer, which calculates the motion of the soundboard at the resonances and shows an animated picture of the vibrating soundboard in slow motion. By a proper choice of perspective and gain, the vibration distribution of the entire soundboard can be seen clearly.*
* During the lecture, video recordings of the vibrating soundboard were shown. In the figures that follow, the soundboard resonances are illustrated by "snapshots" of the deflections at the positive and negative maxima, respectively.
The principle of modal analysis is explained in the block diagram in Fig. 12. First, a net of measuring points are marked on the structure under investigation - in this case the soundboard of a grand piano. The measuring points are then excited in succession by blows of a small hammer, featuring a built-in force gauge. A small contact microphone (accelerometer), which is fixed to the soundboard at a certain point, registers the resulting vibrations. The electrical signal from the accelerometer is sent to a computerized analyzer together with the force signal from the hammer.
Using the technique described above, the modes (resonances) of the soundboard of a concert grand (length 2.90 m), with the iron plate and strings included, were investigated (see Fig. 13 - 16).
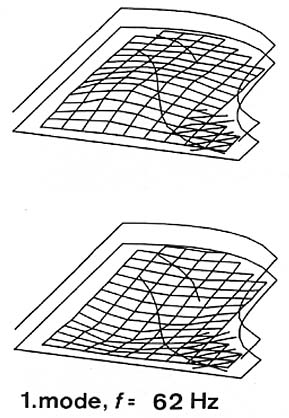
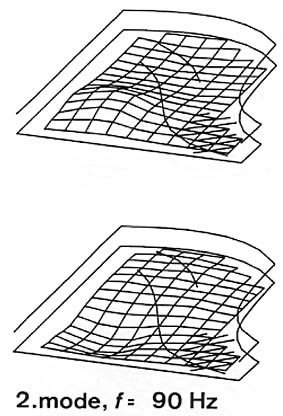
Fig. 13. First and second mode of the soundboard of a concert grand piano (length 2.9 m).
The first mode has a resonance frequency of 62 Hz, and the deflection distribution shows only one vibration maximum with equal phase all over the soundboard (see Fig. 13, left). The vibration maximum is located in the front left third of the soundboard. The treble area at the front end of the treble bridge hardly vibrates at all.
In the second mode at 90 Hz, the front half vibrates in opposite phase compared to the far half, with a zone of small deflection in the middle between these areas (Fig. 13, right). In this zone there is a nodal line running parallel to the keyboard along the middle of the soundboard. (Modes with this orientation of the nodal lines are sometimes referred to as longitudinal modes.)
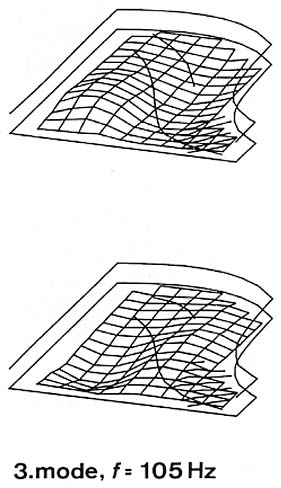
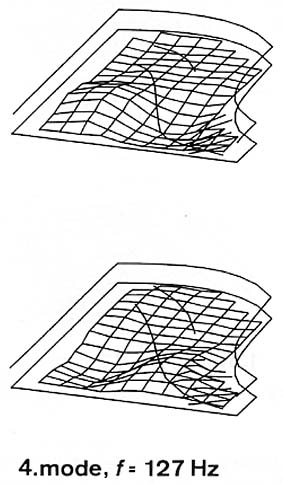
Fig. 14. Third and fourth modes of the same soundboard.
The third mode at 105 Hz (Fig. 14, left) is not a following third longitudinal mode, but a transversal second mode. In the third longitudinal mode, three sections with antiphase motions, separated by two transversal nodal lines, should develop. This third mode at 105 Hz has the same deflection distribution as the second mode at 90 Hz, except that the nodal line now runs longitudinally (perpendicular to the keyboard). Because of the higher stiffness of the treble area, an asymmetry exists in favor of the bass section.
The fourth mode at 127 Hz is again a longitudinal mode - four vibrating areas moving in opposite phases divided by three transversal nodal lines (Fig. 14, right).
For the following two modes (187 and 222 Hz), the low stiffness of the left part of the soundboard causes a strong motion of this area compared to the right part (see Fig. 15). In addition, the left part is divided into three and four zones of vibrations, respectively.
In the following two modes (245 and 325 Hz), vibrating areas can still be found and identified (see Fig. 16), but for higher modes the vibration zones become harder to recognize.
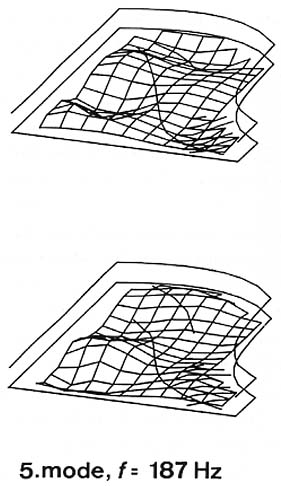
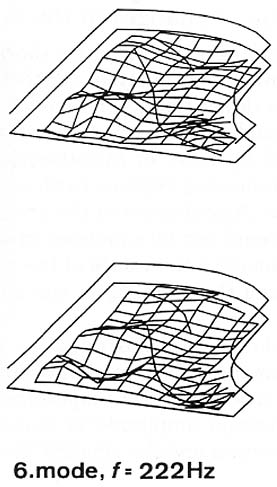
Fig. 15. Fifth and sixth modes.
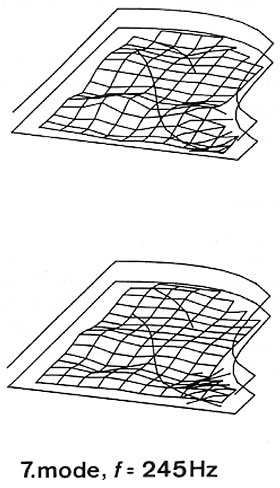
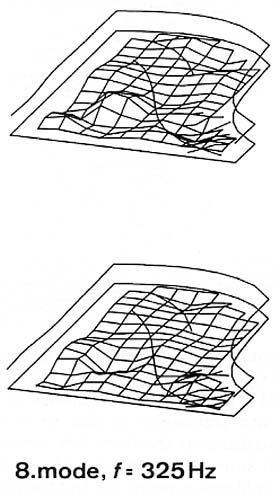
Fig. 16. Seventh and eighth modes.
Important information can be extracted from the modal analysis with regard to the input impedance for different strings, and the decay of the corresponding notes. For example, a mode pattern with a large vibration amplitude at a certain point on the bridge implies a low impedance and hence an efficient energy transfer from a string crossing the bridge at this particular point. This means that the decay time for partials close to this mode frequency will be relatively short.
[<- Previous] [Top] [Contents of this lecture] [Next ->]
This lecture is one of Five lectures on the Acoustics of the piano
© 1990 Royal Swedish Academy of Music