|
High-speed imaging of the larynx
Svante Granqvist
|
 |
Fourier analyses of high-speed recordings
 |
Normal phonation. Every cycle is similar to the other. F0 = 115 Hz
(Animation consists of a single cycle within 16 frames that are repeated over and over) |
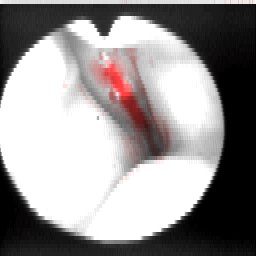 |
In this image, the parts where the light intensity oscillates with 115 Hz have been colored in red. The detection
of oscillation is performed by means of a Fourier transform of gray scale values for each pixel. Thus, for this
image, 256x64=16384 FFTs are calculated, and the frequency 115 Hz is selected. If the amplitude of that frequency
at a certain location exceeds a threshold value, the image is colored in red at that location. |
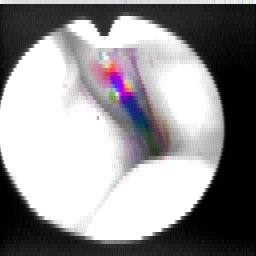 |
This image also displays the phase information from the FFTs in terms of color hue. Different colors indicates
a phase difference in light intensity oscillation at the different locations. In this image, it can be seen that
the anterior and posterior parts of the glottis are differently colored. This is consistent with the animation
above, where it can be seen that the anterior part of glottis opens before the posterior part. |
|
|